
Just imagine… You dedicate months of your free time building your web application, you run some tests with your friends, you write a nice brief and you launch it on HackerNews and ProductHunt. Miracle, it reaches the first page! You can already see it, fortune, fame, thousands of sign-ups, and… 503 Service Unavailable!
This could be avoided with simple load testing. It allows you to generate fake traffic and simulate hundreds or thousands (or more) of users swarming your website all at once. Then, you can make sure that your servers will be able to handle the traffic that you expect to receive.
The goal of this article is to present you a simple way to load test your website, with minimal efforts and in only a few minutes. Reading the article will take longer than configuring your load test.
Start load testing with JMeter
There are plenty of solutions available for load testing, in different languages and with different ways to write the tests. Popular choices are Locust.io and Apache JMeter for example. If you want to run automated load testing as part of your continuous deployment pipeline, just make sure to choose a framework suitable for that purpose.
At work I use a proprietary in-house solution, so I needed to find a new tool for load testing this blog. Since I rarely need to test my server, I don’t want to invest a lot of time in it. I settled on JMeter because of the following advantages:
- It is popular enough to be supported long term and have integrations should I ever need them,
- It is easy to setup and configure, and it can be done using a simple GUI,
- It supports testing for a lot of protocols, not only HTTP but also databases, SMTP, or messaging queues,
- It is written in Java, so it will run on most operating systems.
There is one slight downside which is that unlike other solutions it is not a headless browser, so JavaScript will not be executed on the page. This does not prevent you from running load testing on your Angular or React application and seeing if your server returns the expected response, but keep it in mind if needed.
Setting up
The installation process is very simple, just download the binaries from the official website and extract the archive in the folder where you want to setup JMeter.
It’s done, you can now start the GUI by running the script called jmeter in your command line (the .bat version will work for Windows and the .sh for Unix systems).
In the GUI you will configure your test plan, which is the list of actions that JMeter will run as part of your load test. You can start from a blank state and add configuration manually by right-clicking on the “Test Plan” on the left panel, but it is easier to use an existing template.
To do so, go in File > Templates and select the “Building a Web Test Plan” option before continuing.
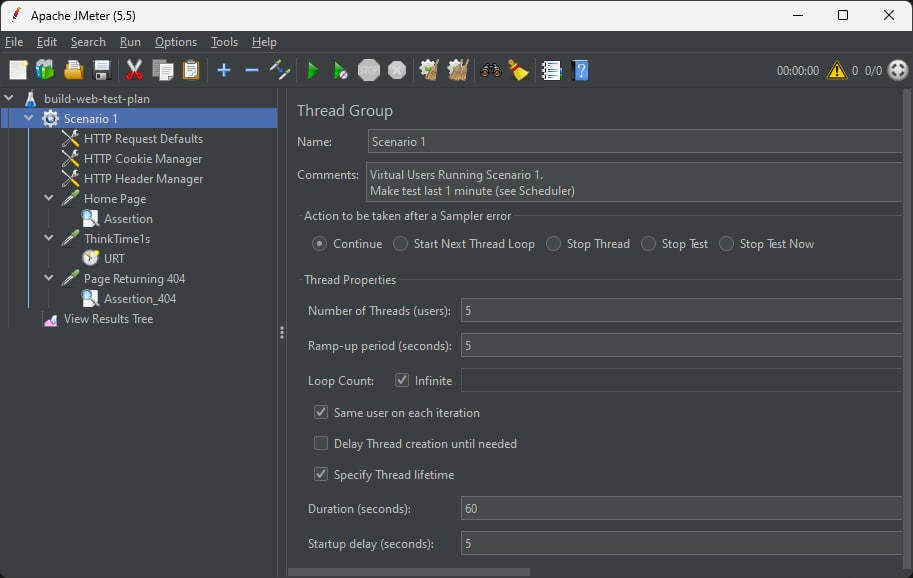
This will provide you with everything you need for the basic load testing of your website. Here are the important parts to customize:
- In
Scenario 1, you can change theNumber of Threadsand theDuration, which respectively represent the number of simulated users, and the duration of your load test. - In HTTP Request Defaults you can define configuration that will be used for all your tests, such as the protocol (
https) or server name (www.mindflash.org). You should also setup the timeouts in theAdvancedtab. - In
Home Pageyou can configure which page you want to test by changing the path (/coding/low-effort-load-testing-for-your-website-in-5-minutes), - In
Assertionit is important to customize thePatterns to testto match a text that is appearing on your page.
You can right-click on Scenario 1 to add new URLs to test (Add > Sampler > HTTP Request), and you can delete the ones that you judge not useful such as the 404 testing. Remember that different pages may have a different impact on your webserver.
There are a lot of configuration possibilities, and some were added by the template (such as the cookie configuration), but this is should be enough to test a lot of websites.
Running a load test
Now that you have the .jmx file that describes your test plan, we can actually run the load test.
JMeter warns you when you first start the GUI, you should not use it to run the test, and instead should use the command line. Once again, it is very simple, run the following command to run your load testing plan:
jmeter -n -t [your jmx test file]
The -n option will run the program without UI, and -t just specifies which test plan file to use.
Then, your test will start running and hitting your website, for the period and with the amount of users that you configured:
Creating summariser <summary>
Created the tree successfully using HTTP Request Defaults.jmx
Starting standalone test @ November 16, 2022 10:06:38 PM GMT (1668636398201)
Waiting for possible Shutdown/StopTestNow/HeapDump/ThreadDump message on port 4445
summary +    542 in 00:00:22 =   25.1/s Avg:   111 Min:    20 Max:   650 Err:     0 (0.00%) Active: 42 Started: 42 Finished: 0
summary +   2145 in 00:00:30 =   71.5/s Avg:   509 Min:    20 Max:  5042 Err:   140 (6.53%) Active: 117 Started: 117 Finished: 0
summary =   2687 in 00:00:52 =   52.1/s Avg:   428 Min:    20 Max:  5042 Err:   140 (5.21%)
summary +   2082 in 00:00:30 =   69.4/s Avg:  1478 Min:    19 Max:  5964 Err:   461 (22.14%) Active: 150 Started: 150 Finished: 0
summary =   4769 in 00:01:22 =   58.5/s Avg:   887 Min:    19 Max:  5964 Err:   601 (12.60%)
summary +   2201 in 00:00:30 =   73.3/s Avg:  1515 Min:    19 Max:  5422 Err:   545 (24.76%) Active: 150 Started: 150 Finished: 0
summary =   6970 in 00:01:52 =   62.5/s Avg:  1085 Min:    19 Max:  5964 Err:  1146 (16.44%)
summary +   2128 in 00:00:30 =   70.8/s Avg:  1604 Min:    20 Max:  8207 Err:   491 (23.07%) Active: 150 Started: 150 Finished: 0
summary =   9098 in 00:02:22 =   64.2/s Avg:  1206 Min:    19 Max:  8207 Err:  1637 (17.99%)
summary +   2037 in 00:00:30 =   68.1/s Avg:  1632 Min:    19 Max:  5069 Err:   538 (26.41%) Active: 150 Started: 150 Finished: 0
summary =  11135 in 00:02:52 =   64.9/s Avg:  1284 Min:    19 Max:  8207 Err:  2175 (19.53%)
summary +   1044 in 00:00:15 =   70.7/s Avg:  1852 Min:    20 Max:  8665 Err:   178 (17.05%) Active: 0 Started: 150 Finished: 150
summary =  12179 in 00:03:06 =   65.4/s Avg:  1333 Min:    19 Max:  8665 Err:  2353 (19.32%)
Tidying up ...    @ November 16, 2022 10:09:44 PM GMT (1668636584804)
... end of run
And you are done, you have successfully load tested your website!
You can read the last summary line from the output to know how your load test went, with the following numbers:
summary = 12179is the number of requests ran,in 00:03:06 = 65.4/sis the total duration of the test, and the transactions per second (TPS),Avg: 1333 Min: 19 Max: 8665are the time in milliseconds your server took to answer,Err: 2353 (19.32%)indicates how many requests failed to succeed.
Errors do not necessarily indicate that your website did not load at all, it could also mean that the time to load the page exceeded the threshold you have set.
Optional: Generating an HTML report
The report above gives you some information, but it is not ideal to really analyze the behavior of your website in depth. Thankfully, JMeter allows us to generate an HTML report of our load testing.
Simply add the following options when running your test: -l results.csv -e -o html_report
The -l option will generate a CSV with the data for each individual request, and -e -o will generate the report in the folder specified, and you can then access it by opening the index.html file in your browser.
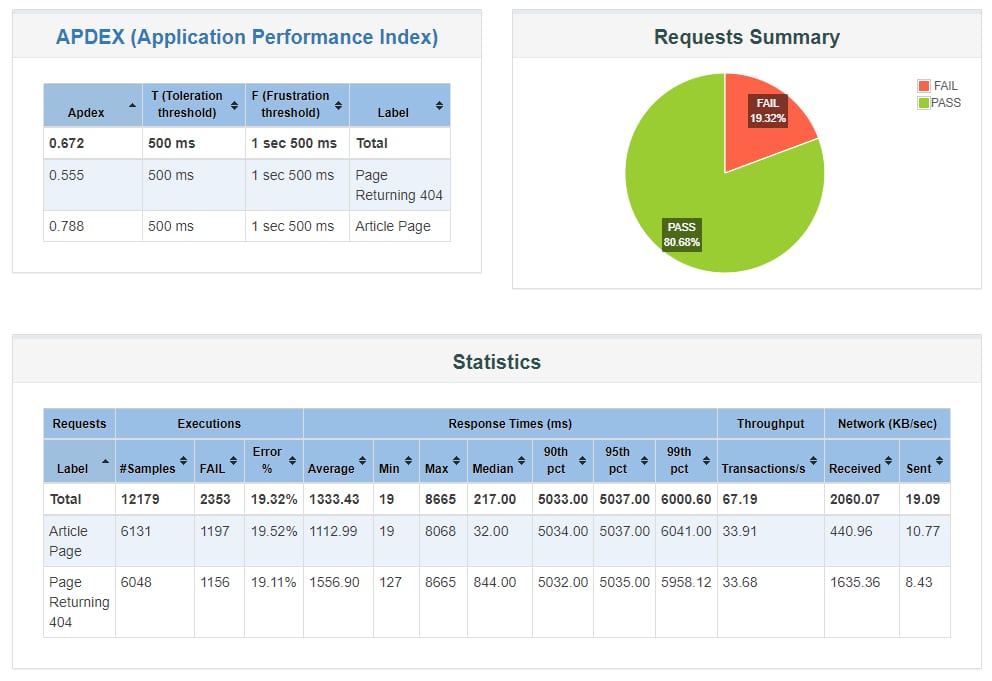
There are plenty of other statistics available, such as a view of the response time over the duration of the full load test, which may indicate problems occurring over time rather than instantly.
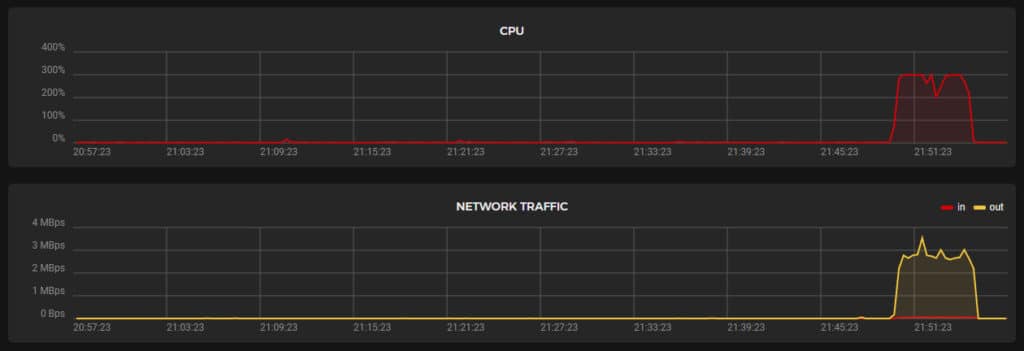
You should also take a look at the graphs of your server to see how it handled the load.
Next steps
As promised, the goal of this article was to provide a lot effort way of doing load testing for your website, however you may want to dive deeper in the possibilities.
JMeter has an extensive documentation about how to fine-tune your test plans and you can extend your use for more complex situations. As mentioned in the reasons why I chose to use it, you can load test your database directly for example.
If you are developing a serious application that is expected to frequently have high load, you should probably make load testing an integral part of your continuous integration pipeline. It is possible to integrate JMeter with Jenkins for example.